11 mins read
The best slots to play carry an RTP above 96%, as higher return percentages give players stronger long-term payout potential...

Using Dogecoin in casinos is one of the best crypto casino strategies, combining fast transactions, low fees, and broad platform...

4 mins read
NEW YORK, NY — Tradeify has officially unveiled Tradeify 3.0 with 40% off coupon code “FUTURE”, a major platform upgrade...

3 mins read
New York, NY — Vetted Prop Firms, the independent trading industry review platform known for analysing and vetting proprietary trading...

Forex trading platforms connect traders to the currency market, offering real-time charts, order panels, and account management tools for informed...

10 mins read
Forex brokers connect individual traders to global currency markets, enabling trades that would otherwise require access to banks and institutions....

A CFD broker lets you trade price movements without owning the asset. CFDs allow speculation on rising and falling markets...

7 mins read
Cryptocurrency remains a nascent industry with ongoing regulatory debates, highlighting the need for advocacy groups to influence policy. Prominent crypto...

7 mins read
Crypto whales are wallets that hold a significant enough amount of cryptocurrency to influence the market. Whales can signal market...

9 mins read
Structured data is highly organized, typically quantitative, and stored in databases or spreadsheets. Unstructured data is unorganized and often qualitative,...

10 mins read
A crypto wallet is a device, document or piece of software that stores the private keys for your cryptocurrency. Different...

13 mins read
Crypto adoption is rising alongside scams: Around 562 million people now own cryptocurrency, and as the ecosystem grows, scams and...

4 mins read
What is the Bitcoin halving? The Bitcoin halving is an event on the Bitcoin protocol, in which the block reward...

4 mins read
P2P VPN meaning: what’s a peer-to-peer VPN? A P2P VPN is a type of Virtual Private Network that has servers...

6 mins read
ScalaHosting is a leading managed hosting provider that offers secure, scalable, and affordable cloud VPS solutions for businesses. It claims...

6 mins read
In the world of digital transformation, organizations are being compelled to integrate technology into their business strategies and operations to...
5 mins read
In the world of digitalization, every business needs to invest in technology to achieve its business objectives cost-effectively. Implementing managed...
5 mins read
KPMG is a professional services firm that helps its clients with a variety of financial, tax, business development, and technology...

4 mins read
Burn up and burn down charts are visual representations of progress in the scope of a project, showing the amount...

7 mins read
Hewlett Packard Enterprise (HPE) is a global, edge-to-cloud Platform-as-a-Service (PaaS) company in the IT, internet, software, and services industry. It...

5 mins read
When changes need to be made to a project after the project has already been approved by the client, a...

3 mins read
Container registry software is designed to store container images while inactive and offers automation features for container management. The software...

10 mins read
Organizations of all sizes can outsource their management of security devices and systems to a Managed Security Service Provider (MSSP)....
5 mins read
As employees and customers alike have changed their IT usage habits as a result of the COVID-19 pandemic, IT service...

6 mins read
Deloitte is a global professional services firm that offers auditing, consulting, advisory, and tax services to companies in a variety...

5 mins read
Stealth mode is a business term that is commonly used to describe taking on new business opportunities, projects, or company...

6 mins read
Venture capital (VC) offers startups and developing businesses growth opportunities with funding from private investors for an agreed-upon stake in...

4 mins read
A third-party application is an application provided by a vendor other than the device or operating system (OS) manufacturer. For...

6 mins read
Ernst & Young Global Limited, commonly known as EY, is a multinational professional services company with headquarters in London, England....

5 mins read
Founded in 2005, Smartsheet is a leading cloud-based project management solution that offers robust features, workflows, and automations to help...

7 mins read
Google Professional Certificates, offered as online certification programs through Coursera, help students and professionals of varying backgrounds build Google and...

5 mins read
Facebook Business Manager is a platform that enables businesses to manage all of their Facebook marketing and advertising elements, including...

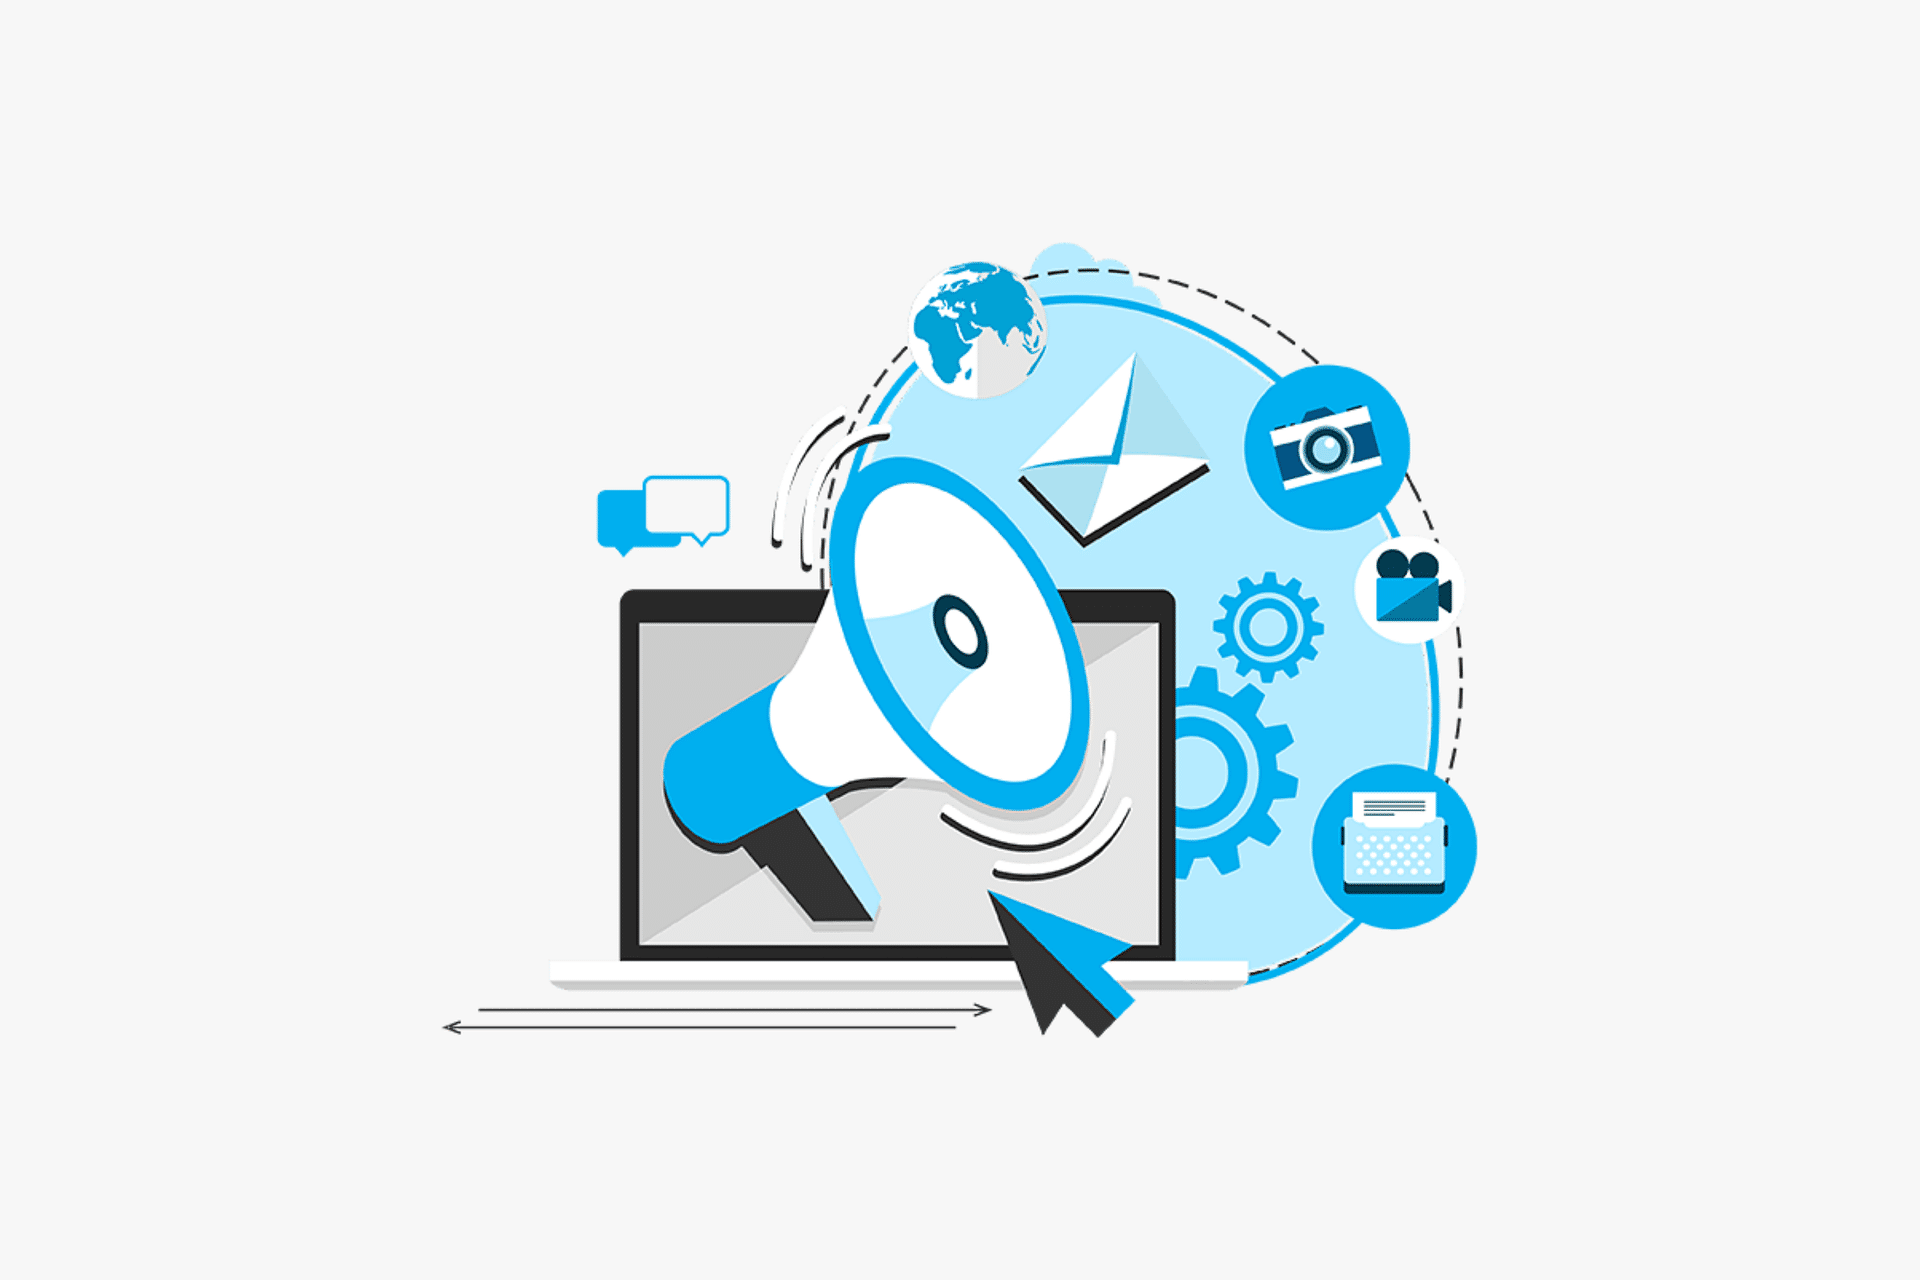
4 mins read
Social media monitoring helps companies leverage the full potential of social media for their brand. If used efficiently, it can...

9 mins read
Accurate, precise, and reliable sales forecasting can make the difference between success and failure for a business, as several functions...

5 mins read
Pipedrive is customer relationship management (CRM) software designed for sales. The software focuses on the sales pipeline, enabling sales teams...

13 mins read
Many companies have had to evolve their businesses to meet consumer wants and needs in new ways. One area that...

4 mins read
Live streaming has grown in popularity due to the quick evolution of audiovisual and streaming technology over the past decade....

5 mins read
Social media platforms are websites or applications that allow users to create and share content or to participate in social...

6 mins read
There are about 4.6 billion active social media users globally, as of early 2022, and Facebook (Meta) is one of...
5 mins read
Coursera is an online education platform that offers a variety of courses and certificate programs from top universities and leading...

5 mins read
A sales funnel is a visual representation of the strategy businesses use to stratify and target their sales tactics to...
3 mins read
A quality management system (QMS) is a centralized system for managing business processes. QMS systems support the goal of meeting...
14 mins read
Customer service software helps businesses run their customer service department easily and efficiently while keeping track of all relevant conversations,...
4 mins read
Social listening is the process of monitoring and analyzing digital interactions and communications on the internet, primarily on social media...

6 mins read
Apptivo offers web-based and mobile applications for sales, marketing, product, and service teams. Although it’s mainly known as a CRM...
5 mins read
Mailchimp is a popular marketing automation platform and email marketing service. While Mailchimp began as an email marketing tool in...

4 mins read
Digital marketing agencies are businesses that provide marketing services to clients across digital mediums like social media and websites. These...

4 mins read
Continuous delivery (CD) is a repeatable and automated process used in software development to expedite the launch of modified or...

4 mins read
Continuous integration (CI) is a software development practice used by DevOps teams to regularly or continuously update code into a...

4 mins read
MOFU, or Middle of the Funnel, is a content marketing term that describes the second stage in the marketing funnel...

The Cisco Certified Network Professional (CCNP) Certification enables networking professionals to prove their skills and knowledge in enterprise networking solutions....

3 mins read
Gated content is a type of marketing content that is significant to the B2B industry, as it can generate potential...

4 mins read
Sentiment analysis—an audience analysis method that relies on text analysis, natural language processing (NLP), and other data mining methods—is increasingly...
3 mins read
A product manager is someone involved in all areas of production, including setting strategies; developing products; and working with relevant...

7 mins read
Companies looking for a business process management or customer relationship management (CRM) tool may wonder if Kintone is the right...
3 mins read
Geotargeting is a method of delivering data or content to users based on their geographic locations. Depending on the application...
10 mins read
Agile project management enables business teams to approach their projects and tasks with a flexible mindset, allowing for both expected...

4 mins read
A private 5G network is a private local area network (LAN) that utilizes 5G cellular technologies and edge device connections...
2 mins read
Rich communication services (RCS) is a mobile messaging approach in which session initiation protocol (SIP) and hypertext transfer protocol (HTTP)...
3 mins read
Organizations often need cybersecurity-certified IT professionals who can design, develop, implement, and manage information security programs at an enterprise level....

13 mins read
Symmetric encryption uses one key for encryption and decryption, while a asymmetric encryption algorithm uses a key pair and public...

5 mins read
ClickUp is a cloud-based work and project management platform that enables teams to manage tasks, collaborate in real-time, gain insights...

3 mins read
To become certified CCSK means that an IT professional has passed examinations for the Certificate of Cloud Security Knowledge (CCSK)....
9 mins read
A cloud service provider (CSP) is an information technology (IT) services vendor that allows clients to manage applications and data...
5 mins read
Change control helps enterprises standardize the request and approval process for any organizational change. It also helps businesses stay compliant...

4 mins read
The National Security Agency (NSA) is the most important intelligence agency in the United States. The NSA’s mission is to...

6 mins read
Project management software is business software that is used to plan and schedule projects, allocate resources, and manage change. Read...

5 mins read
IT service management (ITSM) is a critical component of organizational growth because it centralizes technology resources, issues, and improvements in...

3 mins read
Digital technology continues to evolve at a rapid pace, and it is getting increasingly better at simulating reality. Deepfakes use...

3 mins read
Wrike is project management software that helps businesses and other organizations to manage their project workflows smoothly. Take a closer...

3 mins read
Lean manufacturing is a modern approach to manufacturing that eliminates process and resource inefficiencies. Becoming lean has grown into an...

3 mins read
The term digital native describes younger generations that grew up in the technology age. Most people who are digital natives...

3 mins read
REvil was a Ransomware-as-a-service (RaaS) ransomware attack that affected a number of larger corporations and famous individuals. Read this article...

3 mins read
Tunneling is used in information technology (IT) to move data or communications across a network using protocols that are not...

4 mins read
A contingency plan is a plan of action or “Plan B” for businesses to implement in extraordinary circumstances. Contingency plans...

8 mins read
Fintech, also known as “financial technology,” is a term used to describe companies that use innovative technology to create more...

4 mins read
More and more businesses are adopting an agile approach to achieving their goals, from operations to IT to marketing. The...

5 mins read
What Is Mobile CRM? Mobile CRM software enables sales, marketing, and customer service teams to handle customer relationships and sales...

6 mins read
Agile and waterfall are two popular methodologies or processes for project management. While both methods are similar in that they...
3 mins read
Every project has to deal with a certain amount of risk, no matter how carefully planned. To make risk management...

3 mins read
A rolling release is a type of update or improvement to an existing computer application, mobile app, or software solution....

3 mins read
The AWS Certified Security – Specialty certification program provides skills and knowledge essential for managing the AWS platform securely. Learn...
3 mins read
NetOps, or network operations, is a network management strategy for automating and optimizing processes across nearly any network type in...
3 mins read
Conversational AI is an artificial intelligence technology that comprehends human speech and corresponds with human interaction. Conversational AI is increasingly...

3 mins read
A virtual agent (VA) is an artificial intelligence (AI) program that mimics human conversations. Learn more in this definition. What...

4 mins read
The CRISC (Certified in Risk and Information Systems Control) certification is a qualification that shows proficiency in risk management. It’s...

3 mins read
A flat network is a type of computer network architecture that aims to reduce maintenance, administration, and cost through its...
6 mins read
The waterfall methodology is a project management strategy for projects that already have a predetermined end result and/or a series...

2 mins read
A codebase is a collection of source code for an application, software component, or software system that can be stored...

3 mins read
Businesses are increasing their workloads in ways that can lead to performance issues for various systems, servers, and databases. Performance...

7 mins read
Virtualization software is a digital solution used to create an abstraction layer for hardware. The software creates multiple instances, or...

5 mins read
An agile coach is someone trained in technical or procedural change management who helps to set up agile teams during...

5 mins read
Cloud data warehouses (DWs) enable organizations to store massive amounts of data across cloud servers and access them from anywhere...
3 mins read
A point release is a minor or small update to an existing application or software product. It is typically intended...
3 mins read
In a blockchain network, data is kept in several network nodes that are located at various locations. Decentralization in blockchain...

3 mins read
The Colonial Pipeline Ransomware Attack was a major ransomware attack perpetrated against the oil and gas company, Colonial Pipeline, in...

3 mins read
AutoIt is a popular and easy-to-learn scripting language used by developers since 1999 for quick software development. Here’s more about...

3 mins read
As enterprise networks become increasingly distributed with growing numbers of remote workers, unified endpoint management (UEM) has become an important...
3 mins read
Decision intelligence combines business intelligence (BI) and artificial intelligence (AI) models to improve organizations’ decision-making processes. Learn more about how...

5 mins read
Mobile workforce management (MWM) refers to the tools and software used to manage remote, field, and other employees who work...

3 mins read
The Ryuk ransomware is a strain of malware that attempts to infect and encrypt victims’ files, rendering them inaccessible to...

4 mins read
Snowflake is a data management platform that offers data management and data warehouse services with unique capabilities to handle data....

5 mins read
RIA software helps Registered Investment Advisers (RIAs) and financial advisory firms track client data, documentation, and sales contact history. With...

4 mins read
The Computing Technology Industry Association, abbreviated as CompTIA, is a U.S.-based nonprofit association formed to provide professional certifications in the...

3 mins read
IT Service Management (ITSM) tools are the tools involved in designing, delivering, and managing IT services. These tools support IT...
4 mins read
Unified communications as a service (UCaaS) is a cloud-based communications solution that provides the same functionality as an on-premises private...
7 mins read
The bring your own device (BYOD) phenomenon has changed how businesses interact with employees and, as a result, how companies...

4 mins read
What Is a CRM Manager? A customer relationship management (CRM) manager is a person that oversees all customer and client...

3 mins read
AdamLocker ransomware, or RW.adm_64, is a screen-locking virus designed to prevent access to a computer system and rename the files...

3 mins read
SHA-256 is an algorithm used for hash functions and is a vital component of contemporary cybersecurity. It is part of...

5 mins read
A document management system is an automated software solution businesses and organizations use to organize, share, and secure the documentation...

3 mins read
Conti ransomware first emerged in 2020. It uses a ransomware as a service (RaaS) model in which a malicious group...

4 mins read
Crypt888, also known as Mircop, is ransomware that encrypts files on desktops, downloads, pictures, and documents with RSA algorithms. The...

3 mins read
AutoLocky is ransomware written in the popular AutoIt scripting language. It uses strong RSA and AES ciphers to encrypt files...

3 mins read
Data governance is a term used to refer to the management of processes, roles, policies, standards, and metrics related to...

4 mins read
Capacity planning is a process that helps organizations determine the resources needed to meet the demand of consumers. It is...

10 mins read
The Defense Advanced Research Projects Agency (DARPA) is a research and development agency of the United States Department of Defense...

3 mins read
XiaoBa is a type of file-encrypting ransomware that runs on Windows and encodes victims’ files using RSA and AES algorithms....

6 mins read
Team management software is a type of organizational software that supports remote team management. These tools enable users to assign...
5 mins read
The 2021 ransomware cyberattack on U.S.-based software solutions company, Kaseya, is known as the Kaseya ransomware attack. The attack affected...

6 mins read
A sales CRM, or customer relationship management (CRM) tool for sales, is frequently the centerpiece of sales operations for a...

3 mins read
On March 13, 2002, the ExecuPharm ransomware attack was used to encrypt and steal corporate and employee data of ExecuPharm,...

3 mins read
DarkSide ransomware, first discovered in August 2020, is used to perform sensitive data theft and send threats to reveal that...

5 mins read
What is contact center CRM? Contact center CRM tools, or call center CRM tools, help businesses with call centers manage...

4 mins read
LogMeIn Rescue is a software-as-a-service (SaaS) solution that offers remote desktop software and communication technology support. Founded in 2003 as...
11 mins read
Proof of Work (PoW) is a consensus mechanism that secures blockchains by requiring miners to solve complex computational puzzles in...

3 mins read
Blockchain networks are essentially distributed databases of digital transactions or events. The network’s nodes must reach an agreement to complete...
6 mins read
LastPass is a cloud-based password manager that stores users’ login information online in a secure database and allows users to...
3 mins read
Zero-knowledge proof is a concept of cryptography. It enables a given entity to prove that a particular statement is true,...

5 mins read
On December 11th, 2021, Kronos announced that its application had been attacked by hackers who exploited the security protocols to...

8 mins read
The Internet of Things (IoT) is the network of physical objects that feature an IP address for internet connectivity and...

6 mins read
Robotic process automation (RPA) is a way to automate repetitive, time-consuming tasks using software with machine learning (ML) and artificial...

2 mins read
Brave is an open-source web browser built on the Chrome web browser with a focus on user privacy. How Is...
3 mins read
Blockchain as a service (BaaS) is a service model provided by third-party vendors to help companies optimize existing blockchain technologies...

3 mins read
A sidechain is a type of blockchain network that allows cryptocurrency to be transferred between multiple blockchains. What is a...
3 mins read
The base blockchain layer of a cryptocurrency such as Bitcoin is called the mainchain. What does the mainchain do? This...
4 mins read
Data poisoning is a type of adversarial attack in which attackers try to manipulate training datasets of machine learning (ML)...

8 mins read
DevSecOps encompasses two similar but different approaches to software development and often features references to security. First, DevOps is a...

7 mins read
A cryptocurrency trading platform is an online portal (exchange) that facilitates crypto-to-crypto transactions. They support the trading of digital assets,...

5 mins read
Adaptive web design is an approach to developing websites that uses a separate page layout adapted to the screen proportions...

5 mins read
Trolling describes the action of someone trying to antagonize others online with intentionally inflammatory or negative statements. The history of...

5 mins read
Qualcomm is a global technology company specializing in telecommunications intellectual property (IP), including next-generation networks, smart devices, semiconductors, and mobile...
7 mins read
Horizen is a privacy-centered blockchain scalability platform. What does Horizon do? Horizen uses sidechains to scale its network. This network...
3 mins read
Adversarial machine learning (ML) involves the disruption of machine learning practices, which can stall business processes or even cause serious...

2 mins read
Business intelligence (BI) powers the new economy, but BI acronyms and abbreviations seem to power BI. Whether you’re new to...
4 mins read
Hyperautomation refers to the advanced automation of IT platforms within an organization to enhance the speed and accuracy of work...

3 mins read
Log4Shell was a zero-day vulnerability found in Log4j, a popular Java logging framework used on several Java platforms. Log4j, a...
2 mins read
Reaper is the world’s first antivirus program, although at the time it was made, in the early 1970s, there was...

6 mins read
IoT (Internet of Things) security helps enterprises protect their networks from threats exacerbated by internet-connected devices, which often aren’t designed...

8 mins read
IT outsourcing is the practice of using external resources by subcontracting some or all of the information technology (IT) functions...

6 mins read
A chatbot, chat bot, or chatterbot, is an application that conducts automated conversation through an online messaging platform. The application...

2 mins read
The human resources (HR) industry uses countless abbreviations and acronyms. Whether you’re new to the HR category, you’re part of...
4 mins read
Alibaba Group is an international technology company with a deep portfolio of companies offering global buyers and sellers platforms to...

3 mins read
The Health Information Technology for Economic and Clinical Health Act (HITECH Act) compromises several protections, protocols, and procedures that shift...

3 mins read
A CTF event, the acronym for Capture-the-Flag event, is a computer security competition that requires individual and team contestants to...

3 mins read
Creeper is considered the first ever computer virus. Learn more with this definition.

9 mins read
Ransomware as a service (RaaS) is a business model similar to SaaS, in which individuals or organizations pay ransomware developers...

6 mins read
Internet of Things (IoT) companies provide networking, device, and sensor technology to organizations to connect all devices to the internet...

5 mins read
Social media optimization (SMO) is the process of increasing awareness of a product, brand, or event on social media. SMO...

3 mins read
MLOps (Machine Learning Operations) is an engineering function of a team composed of programmers, data scientists, and DevOps engineers tasked...

4 mins read
Training data is used to increase the accuracy of machine learning algorithms with examples of desired and undesired outcomes. As...
3 mins read
AIOps is a multi-layered platform using artificial intelligence (AI) and machine learning (ML) technologies to manage complex IT operations and...
5 mins read
Governance, risk, and compliance (GRC) refers to a company’s strategy for managing the issues of corporate governance, enterprise risk management...

7 mins read
Cryptocurrency has quickly become a digital alternative to state-backed traditional currencies thanks to distributed crypto mining rigs built to validate...

3 mins read
Machine code is the language of digital computers consisting of instructions expressed in a string of binary digits or bits...

4 mins read
The Gramm-Leach-Bliley Act (GLBA), passed in 1999, outlines regulations related to financial data protection that must be followed by financial...

4 mins read
In the computing world, full stack refers to the entire set of software solutions and technologies applied to build a...

4 mins read
RoboForm is a password manager application capable of generating and remembering passwords, logging into saved websites in the browser, and...

4 mins read
A hacker is a person who uses computer programming to overcome a problem or challenge within a computer system. While...

4 mins read
A hacker is a person who uses computer programming to overcome a problem or challenge within a computer system. While...
4 mins read
A programmer is a professional who writes software code for computer applications and software programs according to a software developer’s...

3 mins read
Digital human as a service (DHaaS) is an AI technology interface that physically looks, sounds, and behaves like real-life humans....

3 mins read
Data discovery is the process of bringing together disparate datasets and creating new threads of meaning with the data. As...
4 mins read
Machine learning software (MLS) is a tool for creating advanced computer applications that employ massive datasets and complex algorithms to...
8 mins read
Predictive analytics is a proactive approach to harnessing enterprise data, detecting patterns, and helping businesses prepare for events that are...

2 mins read
A dataset is a structured collection of data in the form of documents, videos, images, or other types of files....

3 mins read
End-to-end encryption (E2EE) involves encrypting data and information between sending and receiving devices, so no other interceptors without the correct...

4 mins read
Arctic Wolf Networks (AWN) is a cybersecurity company offering cloud-native managed security operations solutions as an alternative to a traditional...

6 mins read
Fortinet is a cybersecurity vendor with two decades of experience and an extensive stack of solutions for channel partners, service...
The best PLM software systems support all of a business’s product-related processes, from the first product idea all the way...

3 mins read
6G is the acting name that refers to what will be the sixth generation of cellular technology. Current 6G theoretical...

3 mins read
Quantitative data is any set of numerical data, typically used for mathematics or statistics, that can be analyzed and measured...

2 mins read
Statistical data analysis, also known as descriptive analysis, involves collecting and analyzing categorical data based on a predetermined method for...

3 mins read
Sucuri is a web application security company specializing in comprehensive website security for individual sites up to enterprise web content...

3 mins read
Raspberry Pi (RP) is the educational charity and namesake line of microcomputers offering customers a low-cost, single-board computer for lightweight...

4 mins read
A watering hole attack, or strategic website compromise attack, is a hacking technique used to compromise a site that is...

3 mins read
Qualitative data is any set of data, including text, images, and video, that expresses the subjective and interpretive qualities of...

5 mins read
Ubiquitous in early computing from 1970 until the early 2000s, the floppy disk is a portable storage device that has...

4 mins read
As the term implies, a human firewall is a group of people or employees who are committed to following the...

3 mins read
Userpilot is a cloud-based product experience and end-user engagement platform. Who is Userpilot for? It is typically used by freelancers...
3 mins read
Network monitoring software is an application that observes traffic and device behavior on a network, either the internet or an...

3 mins read
Net promoter score (NPS) measures customers’ loyalty, satisfaction, and willingness to recommend a company’s services or products to others. The...

4 mins read
Data annotation involves processing a set of raw data for text, images, sounds, and videos to be used in AI...

5 mins read
Imperva is a cybersecurity company focused on protecting web applications, APIs, data, cloud networks, and edge networks for business clients....

4 mins read
Barracuda Networks is a multinational cybersecurity company specializing in email and web security with industry-recognized web application firewalls (WAF) and...

2 mins read
Merkle proofs describe the verification process for identifying the components of cryptographic data structures known as Merkle trees. Merkle proofs...

3 mins read
Merkle trees—or hash trees—are cryptographic algorithms allowing for the efficient validation of large data structures and are critical to the...

4 mins read
Nimble CRM is a social CRM (customer relationship management) with sales and marketing features. Nimble CRM is used for organizing...
4 mins read
Insightly CRM is customer relationship management (CRM) software that focuses on an intuitive, friendly, and easy-to-understand user interface. It has...
3 mins read
When a system administrator finds anomalous or malicious behavior within network traffic, evidence could show it is an indicator of...

6 mins read
A disk drive is a device that allows a computer to read from and write data to a disk. The...

3 mins read
For the cloud-first organization, Firewall as a Service (FWaaS) brings all the features of next-generation firewalls to a convenient and...

3 mins read
Abnormal Security is an email security vendor offering organizations cloud-native solutions to guard against phishing, malware, and account takeover and...

4 mins read
Freshsales CRM, formerly known as Freshworks CRM, is a customer relationship management (CRM) platform designed specifically for sales. Freshsales is...
4 mins read
Oracle CRM is a customer relationship management (CRM) tool that provides lead and contact management, reporting and analytics, AI, sales...

4 mins read
Sugar Sell (formerly SugarCRM) is a customer relationship management (CRM) solution for medium to large enterprises. Its key advantages are...
5 mins read
Hybrid cloud storage is any data storage environment that combines at least one public cloud solution with at least one...

5 mins read
Freshdesk CRM is a cloud customer relationship management (CRM) service that offers email ticketing, live chat, and phone support for...
From A3 to ZZZ we list 1,697 SMS, online chat, and text abbreviations to help you translate and understand today’s...

4 mins read
Copper CRM, formerly known as ProsperWorks CRM, is a customer relationship management (CRM) software designed specifically for integration with Google’s...
3 mins read
UEBA is an acronym that stands for User and Entity Behavior Analytics. It is a category of security solutions that...

3 mins read
The clawback provision is a clause in an employment or business contract that allows the company to reclaim the money,...
4 mins read
FOMO is an acronym for Fear Of Missing Out, which is a feeling of envy or anxiety over missing out...

3 mins read
The world of project management is full of abbreviations and acronyms, and it’s important to understand what they mean. We’ve...

2 mins read
Litecoin is a peer-to-peer, open-source cryptocurrency that was developed as an alternative to Bitcoin. Litecoin is nearly identical to Bitcoin...

11 mins read
Dogecoin, born as a meme in 2013, has grown into a widely used digital currency backed by an enthusiastic and...

7 mins read
A chief information security officer (CISO) is one of the latest additions to enterprise C-suite roles, offering executive oversight, strategic...
6 mins read
A storage area network (SAN) is a high-speed network that provides access to data storage at the block level. It...

3 mins read
A brute force attack is a frequently used cryptographic method where threat actors rely on computing power to estimate potential...

6 mins read
Information technology (IT) is the field concerned with all aspects of managing and processing information, especially within a large organization...

4 mins read
RSA SecurID is multi-factor authentication (MFA) technology used to protect network resources, such as applications and websites. Its purpose is...
3 mins read
Microsoft Edge Chromium is a web browser that is built on Chromium instead of Microsoft’s own web browser technology. It...
4 mins read
A stack is a collection of items or elements used in programming languages. It is usually referred to as an...
4 mins read
Software engineering is the systematic and disciplined approach to the design, development, testing, implementation, and maintenance of application software and...
4 mins read
Adobe Connect is a digital learning and collaboration software suite developed by Adobe Systems that allows users to securely set...

3 mins read
A silent install is when an application or program is loaded to a user’s computer without any dialogs or user...
6 mins read
Webroot is a cybersecurity software company that offers internet security for individual consumers and businesses. It provides antivirus and internet...
3 mins read
The metaverse is the concept of a centralized virtual world that can be used for a variety of purposes, such...
3 mins read
An applicant tracking system (ATS) is a software application designed to automate and streamline the hiring process, collecting on one...
4 mins read
Password fatigue is the term given to the feeling of exhaustion or resistance to creating and using complex passwords. This...
3 mins read
The Melissa virus is a type of mass-mailing macro virus that has been around since 1999. It is designed to...
2 mins read
An on-screen display (OSD) is the graphic image, text, or information shown on TVs, cameras, monitors, DVDs, and VCRs. It...
3 mins read
A hotfix, also known as quick-fix engineering (QFE) update, is a term used by software developers or programmers to describe...
2 mins read
Cold calling is the process of contacting sales leads without any prior interaction. It is contrasted with warm calling, where...

2 mins read
Skillshare is a project-driven online learning community. Skillshare users have access to a large library of video courses and guided...

3 mins read
An iterative process is a sequence of procedures that facilitates the creation of a more refined product or application. What...
3 mins read
A vendor is an individual or organization that sells goods or services to another individual or organization through a stable...
4 mins read
Dropshipping is an e-commerce business model where organizations take online customer orders for specific products, find wholesale suppliers that can...
5 mins read
Microsoft Dynamics is a line of customer relationship management (CRM), enterprise resource planning (ERP), and digital marketing applications for small...
11 mins read
Launched in 1996, Hotmail was one of the first public webmail services that could be accessed from any web browser.

4 mins read
Baidu is China’s dominant internet search engine company. It is one of the largest artificial intelligence (AI) and internet companies...

3 mins read
Hootsuite is a social media management tool designed to help its users manage all of their social media activity in...
3 mins read
Glassdoor is an online job search and review platform for people seeking new opportunities. They can search for jobs that...
4 mins read
GitLab is a DevOps platform where software development and IT operations teams collaborate in one place. It aims to increase...
4 mins read
Udemy is a massive open online course (MOOC) platform offering a range of learning courses designed for students and professionals...
3 mins read
Workday is a human capital management (HCM) tool that leverages data analytics, combining HR, finance, management, and enterprise planning in...
3 mins read
Firebase is development software for building mobile and web applications. When Google acquired it in 2014, the tech giant made...
3 mins read
eFax is a digital platform for sending and receiving faxes digitally via email, mobile app, and a secure online portal....
3 mins read
A Packet Inter-Network Groper, or ping, is a software utility network program used to test and verify the reachability of...

3 mins read
A Chief Financial Officer or CFO is a senior executive in charge of overseeing a company’s finances. As a member...

4 mins read
Kotlin is an open-source, object-oriented, and cross-platform programming language developed by JetBrains. Launched in July 2011, Kotlin is now maintained...
4 mins read
Uber Technologies Inc. (Uber) is a technology-based company in America popularly known for its ride-hailing services. Being one of the...
3 mins read
An entity name can be anything referred to with a proper noun that constitutes a specific type of lexical unit...

4 mins read
Contrast Security is a cybersecurity company specializing in application security testing, embedded systems, and threat prevention for organizations relying on...

4 mins read
Cloud backup refers to the practice of copying files or databases to a cloud-based server so it can be restored...

2 mins read
In internet jargon, a catfish is a user who assumes a false identity for purposes of deception. A catfish might...

3 mins read
Ethereum is an open-source blockchain and cryptocurrency platform that hosts applications, digital currency, and payment systems. It uses Ether (ETH)...

2 mins read
Bluehost is a top web hosting provider for businesses looking to create a website. The company is known best for...

3 mins read
Telehealth, also known as telemedicine, describes the use of digital communication technologies to access health-related services and information. It is...

3 mins read
TaskRabbit is an online and mobile on-demand marketplace that connects freelance labor with those who need assistance for a variety...
3 mins read
SurveyMonkey is an online survey tool used to create online surveys, polls, and quizzes. Overall, SurveyMonkey is effective for individuals,...

4 mins read
A non-fungible token (NFT) is a digital asset that has been tokenized with unique digital certificates by its creators, making...
3 mins read
InfusionSoft (rebranded as Keap as of January 2019) is a SaaS company offering email marketing, e-commerce, and customer relationship management...
3 mins read
The General Data Protection Regulation, commonly referred to as GDPR, is an EU regulation concerning data protection and privacy in...

4 mins read
HubSpot CRM is a SaaS-based customer relationship management (CRM) service that integrates with HubSpot’s inbound marketing, sales, and customer service...
5 mins read
Salesforce is a SaaS company and cloud customer relationship management (CRM) software platform. It includes an ecosystem of applications for...
3 mins read
Oracle NetSuite is a cloud-based enterprise resource planning (ERP) platform with robust financial management solutions. NetSuite also includes customer relationship...
4 mins read
Integrated risk management (IRM) is a comprehensive approach to risk management strategies that involves all internal and external factors that...

7 mins read
Kubernetes (K8s) is an open-source container management software developed to help organizations in orchestrating machines that power modern cloud applications....

3 mins read
Adobe Acrobat DC is Adobe’s all-in-one PDF solution that lets its users, on desktop and mobile, create and convert, edit,...

4 mins read
Deployment refers to the process of installation of software or going live with new websites, which includes all the steps—installation,...
4 mins read
What is Absolute Location? Absolute location refers to an exact location of a place based on the geographic grid system...

3 mins read
Calendly is an SaaS platform that allows people to schedule meetings and events at a mutually workable time without the...
5 mins read
Business intelligence (BI) refers to the tools, systems, and strategies that create analysis and planning processes within a corporation. Comprehensive...

3 mins read
Visual Studio (VS) Code is an open-source code editor primarily used to correct and repair cloud and web applications coding...

3 mins read
A SSL (Secure Socket Layer) Certificate is a digital license that ensures an encrypted data connection between a website or...

4 mins read
Collaboration software is a platform where teams can interact and share information, knowledge, diagrams, photographs, documents, files, etc. It’s a...

4 mins read
Facial recognition software is a category of applications designed to identify or confirm a person’s identity in photos, videos, or...

3 mins read
The Chief Executive Officer (CEO) is the highest-ranking individual in a company in terms of leadership roles and responsibilities. The...

3 mins read
Adobe Spark is a suite of apps by Adobe Systems used to create websites, social posts, short videos and other...

2 mins read
To render an image is to use software to convert code into a two- or three-dimensional image so it can...

3 mins read
Fastly is a US-based cloud computing service provider. It offers an edge cloud platform designed to extend the core cloud...
3 mins read
RingCentral is a voice-over-internet protocol (VoIP) that helps business owners communicate seamlessly with their customers and employees over the internet...
3 mins read
Fast-moving consumer goods (FMCG) or consumer packaged goods (CPG) are occasional or everyday consumer products that sell out fast and...

3 mins read
A platform, in general, can be defined as a hardware or software architecture that acts as a basic structure upon...

4 mins read
A vector image is a digital image in which points, lines, and curves based on mathematical equations are used to...

2 mins read
Snail mail, also called direct mail, is a slang term for paper mail that is delivered through the postal system....

3 mins read
CC and BCC are two options to add third-party recipients to an email. Unlike regular recipients in the “To” field,...

3 mins read
Eventbrite is an online event posting, event management, and ticketing website. Eventbrite can be used by businesses to create,...

3 mins read
Docker is an open-source platform used for developing and running applications by allowing users to package the software application into...
3 mins read
Blockchain is one of the core technologies behind cryptocurrency. Blockchain is a system of recording digital transactions making it virtually...
3 mins read
Cached data is designed to improve the user experience when browsing the internet or using an app. When a user...

3 mins read
A CCTV or closed-circuit television is a system of interconnected cameras that capture images that can be recorded or viewed...

4 mins read
Secure Sockets Layer (SSL) is a protocol developed by Netscape for providing a secure connection between two or more devices...
4 mins read
Malwarebytes is a cybersecurity company specializing in network and internet security software, offering one of the top endpoint security solutions...

5 mins read
Sophos is a cybersecurity company specializing in network security and unified threat management through its detection and response, firewall, cloud,...

4 mins read
What is CRM? Customer relationship management (CRM) describes all aspects of sales, marketing, and service-related interactions that a company has...

3 mins read
Amazon Simple Storage Service (Amazon S3) is an infrastructure-as-a-service (IaaS) solution provided by Amazon Web Services (AWS) that offers scalable...

3 mins read
Deprecated or deprecation is the discouragement of the use of a programming language feature. It should not be confused with...
5 mins read
A software-as-a-service (SaaS) company delivers applications to customers over the internet as an ongoing service. SaaS companies provide and manage...

4 mins read
2FA is a login protocol that improves security for organizations and individuals. It is increasingly adopted by enterprises and governments...

3 mins read
Supply chain management (SCM) software tracks products as they move through the manufacturing and fulfillment process. It allows businesses to: ...

3 mins read
Microsoft Paint is a raster-based graphic design application exclusively available on the Windows operating system. It allows amateur users to...
3 mins read
ZipRecruiter is a popular online job board and recruitment platform that was founded in 2010 by Ian Siegel. It has...

3 mins read
ZoomInfo is a software as a service (SaaS) company that provides detailed information on millions of businesses and business professionals....

3 mins read
Threatware (malware, spyware) is a category of malicious computer programs designed to harm computers. The programs are spread by cybercriminals...

6 mins read
1Password is a password management system employed by enterprises to store employee passwords. 1Password allows users to save complex, strong...
2 mins read
Microsoft Intune is a cloud-based mobile device management and mobile application management solution. Available through Microsoft Endpoint Manager, Intune is...
2 mins read
Business continuity software provides a centralized digital platform for maintaining business continuity plans, keeping them updated based on the organization’s...

3 mins read
Adobe Stock is a service that provides access to high quality, royalty-free stock assets for content creators. Adobe Stock offers...

4 mins read
Big Data is a phrase used to mean a massive volume of both structured and unstructured data that is so...

4 mins read
JavaScript is a lightweight programming language used to build and manage dynamic and interactive web elements. It is considered both...

3 mins read
Wireshark is an open-source network protocol analyzer that allows users to capture packets and see protocols or web traffic on...

3 mins read
WeTransfer is an electronic file transfer service that allows users to upload and send large files. It leverages Amazon’s cloud...
4 mins read
GoToMeeting is LogMeIn’s communications software for online meetings, video conferencing, desktop sharing, and collaboration for organizations working with geographically distant...

4 mins read
Cloudflare is a content delivery network (CDN) that ensures the security, integrity, and reliability of a company’s IT infrastructure, applications,...
3 mins read
AnyDesk is a remote desktop (RDP) application that connects and allows access to a computer device, such as a desktop...

3 mins read
An SDK or software development kit, also known as devkit, is a software developer’s toolkit that provides a range of...
5 mins read
Artificial intelligence software is a computer application capable of intelligent behavior like learning, reasoning, and problem-solving. It performs a range...

4 mins read
A cyber attack is an attack on a computing system, environment, or infrastructure that occurs in cyberspace with the intent...

3 mins read
QLED, or quantum dot light-emitting diode (LED), is a display panel used in high-definition TVs (HDTV). The quantum dots or...

4 mins read
Gumroad is an online platform enabling creators and resource producers with a convenient, storefront-free marketplace to sell products like software,...

4 mins read
Trello is a collaboration and project management solution provider offering easy-to-use visualization tools to track, analyze, and optimize workflows for...

4 mins read
Often referred to simply as peer-to-peer, or abbreviated P2P, a type of network in which each workstation has equivalent capabilities...

3 mins read
PeopleSoft is a SaaS platform that that large corporations use to streamline their day-to-day human capital management (HCM), enterprise resource...
5 mins read
What is tokenization? Tokenization involves replacing sensitive data with non-sensitive or anonymized elements, often referred to as “tokens”. What is...

2 mins read
Webex is an enterprise-level web conferencing, communication, and collaboration tool designed by Cisco that gives room for people to host...

6 mins read
What is HTTP? The HyperText Transfer Protocol (HTTP) is the foundation of the World Wide Web. It’s an application layer...
3 mins read
Box.com is a secure, easy-to-use content cloud storage platform built for the entire content lifecycle from file creation and sharing...
5 mins read
A sales development representative (SDR) is an internal sales rep who deals with outreach, prospecting, and lead qualification. Their core...

6 mins read
The ITIL (Information Technology Infrastructure Library) is a strategic approach or guidance geared towards improving overall organization services by focusing...

3 mins read
Xcode is Apple’s integrated development environment (IDE) used in developing software for macOS, iOS, watchOS, and tvOS. The Xcode IDE...

4 mins read
Wide-area networks (WAN) and local-area networks (LAN) describe how physically close devices are within a computer network – which influences...

6 mins read
There are multiple ways to send a text message (also called SMS) to a phone or wireless device on a...

3 mins read
Prometheus software is an open-source application for system monitoring and alerting of hardware and kernel-related metrics. It helps users understand...
3 mins read
Any unauthorized access to a computer network, computer data, devices, or applications is considered a security breach. Typically, a security...

4 mins read
Productivity software is a broad term used for software applications that increase the efficiency of the user or group of...

3 mins read
Third-party logistics, typically referred to by the acronym 3PL, is the process a company uses to outsource logistics services, including...

3 mins read
Citrix Workspace, formerly known as Citrix Receiver, is a cloud-based software platform where users can securely access applications, files, services,...
4 mins read
Single Sign-On (SSO) refers to the user authentication method in which users can access multiple SaaS applications by using one...
3 mins read
The two most common data streaming techniques used in recent times are unicast and multicast. Multicast communication exchange occurs between...

3 mins read
Infosec, shortened from information security, is the field of protecting digital data and information from unauthorized or malicious access or...

3 mins read
LegalZoom is an online legal resource that provides legal document resources to individuals and small businesses. This online legal documentation...
3 mins read
Trustpilot is a consumer review platform that collects and publishes reviews alongside business data. By providing a global community for...
3 mins read
TIFF (Tag Image File Format) is an image format for editing and storing high-resolution digital images. Because it allows color...
2 mins read
iPaaS stands for Integration Platform as a Service. With iPaaS, businesses can build cloud-native data integrations. The platform integrates various...

3 mins read
Streamlabs is a full-stack open-source software application for streaming and broadcasting live videos to a variety of platforms, including YouTube,...
5 mins read
SAP is an end-to-end enterprise solution provider specializing in enterprise resource planning (ERP), business processes, and organization management tools for...

3 mins read
The chief operating officer (COO) is a member of a company’s senior executive management committee. In the decision-making role, the...

3 mins read
Kanban is a workflow management method intended to define, manage, and improve services resulting in knowledge work deliverables. Kanban was...

4 mins read
What is GroupMe? GroupMe is a group messaging application that provides useful and interactive features for group communications. GroupMe chats...
2 mins read
Airtable is a no-code, cloud-based tool that helps businesses create custom databases. Companies of all types and sizes use Airtable...
3 mins read
Figma is a web-based digital design and prototyping tool. It can be used to create mobile app interfaces, websites, social...
4 mins read
Basecamp is an online tool that helps teams collaborate, communicate, and manage projects. Teams use Basecamp to keep track of...
2 mins read
An array is a data structure in computer programming that organizes data. Arrays hold elements with the same data type,...

10 mins read
What is Pardot? Pardot is a B2B marketing automation (MA) solution by Salesforce that enables organizations to track and measure...
4 mins read
Veeam Software is a global vendor of backup and disaster recovery solutions for service providers and organizations to protect network...

3 mins read
Akamai Technologies is a global web technology company specializing in content delivery network (CDN) solutions, cloud services, and cybersecurity for...

7 mins read
A podcast is an episodic form of digital audio content that a user downloads locally to a device or streams...

3 mins read
Upwork is one the most popular and biggest online platforms for clients and freelancers to connect and conduct business. Although...
3 mins read
A headless content management system (CMS) is a type of back-end content management system that makes the content accessible through...

3 mins read
SPOOL (an acronym for Simultaneous Peripheral Operations On-Line) is a buffering mechanism in which data is sent to and stored...

2 mins read
Zapier is a no-code automation tool that translates APIs among hundreds of web applications to simplify integrations and complex workflows....

3 mins read
What is DocuSign? DocuSign is an agreement management application that enables businesses to create, send, and automate a wide variety...
3 mins read
Kerberos is a computer network authentication protocol used for service requests over an untrusted network like the internet. It is...
4 mins read
The C suite (also “c-suite” or “c-level”) refers to a collection of high-level business executives whose primary responsibilities are for...

2 mins read
HTTPS (Hypertext Transfer Protocol Secure), the secure update of HTTP, uses an authentication process to encrypt the connection between web browsers (or clients) and servers. This process overlays Transport...

3 mins read
In Microsoft Excel, a drop-down list is used to enter data into a spreadsheet from a predefined items list, limiting...

9 mins read
A password manager is a software application or a hardware device used to store and manage a person’s passwords and...
2 mins read
Secure File Transfer Protocol (SFTP) is a File Transfer Protocol governed by the Internet Engineering Task Force (IETF) to ensure...

3 mins read
Multi-factor authentication (MFA) is an electronic authentication process that provides extra layers of security to an application or service against...

4 mins read
Machine Learning (ML) is a sub-branch of Artificial Intelligence (AI) that enables computers to learn, adapt, and perform the desired...
2 mins read
Security orchestration, automation, and response (SOAR) is a threat management strategy that identifies security threats against organizations and responds to...

3 mins read
Jotform is an online application for building and managing custom online forms. Jotform provides an easy-to-use and intuitive drag-and-drop interface...

4 mins read
A brand ambassador is the human face of a brand, representing, promoting, and building its credibility to attract customers. Brand...

3 mins read
Stack overflow is an error in programming that a user-mode thread encounters when attempting to write more data but the...

3 mins read
An Integrated Development Environment (IDE) is software designed to simplify the development process of applications by coordinating all programming and...

4 mins read
Convergence is the merging and integration of two or more distinct technologies in a single system. For example, a smartphone...

4 mins read
Whitelisting is a cybersecurity strategy that only allows an approved list of applications, programs, websites, IP addresses, email addresses, or...

3 mins read
Pycharm is a dedicated and cross-platform integrated development environment (IDE) for the Python programming language. It incorporates a wide range...
3 mins read
Marketo is a data-driven marketing automation platform offered as Software-as-a-Service (SaaS). With its advanced, AI-powered application tools, Marketo provides businesses...

5 mins read
Biotechnology leverages biological systems to create valuable products and industrial processes. This innovative approach to solving problems has an immense...

3 mins read
Soft skills are non-technical attributes, characters, and interpersonal skills that define how a person relates with their professional colleagues and...

6 mins read
A SIM card (Subscriber Identity Module) card is a tiny, portable memory chip or integrated circuit containing unique information that...

4 mins read
Army Knowledge Online (AKO) is an enterprise-level information resource or portal used to share and disseminate knowledge to authorized military...

3 mins read
Zendesk is software as a service that offers CRM and IT help desk solutions for businesses. Zendesk simplifies help desk...

7 mins read
Cyber security tools are software programs or hardware appliances built and sold to organizations and consumers to facilitate, manage, or...

2 mins read
Remote monitoring and management (RMM) software performs and automates IT tasks for managed service providers (MSPs) and other enterprises. IT...

3 mins read
CrowdStrike is a cybersecurity company dedicated to stopping breaches through endpoint security and cloud-native network security solutions for SMBs to...

3 mins read
Fios is Verizon Wireless’s bundle solution for internet, phone, and television services. Fios is an abbreviation of Fiber Optic Service...

3 mins read
Web hosting makes a web server available to businesses with varying degrees of provider management. Customers host their websites on...

7 mins read
What is a Denial of Service (DoS) Attack? A Denial of Service, or DoS as it is often abbreviated, is...

4 mins read
Agile project management tools use an approach to project management that focuses on improvement, regular assessment, tasks, and the people...

2 mins read
Asana is a cloud-based project and work management software company that streamlines project design and implementation through a collaborative digital...
2 mins read
DDoS software protects a server or network against Distributed Denial of Service (DDoS) attacks. The DDoS attack, a type of...
2 mins read
Flash is a vector-graphic animation technology. Introduced in 1995 as FutureSplash, Flash was designed to be bandwidth-friendly and browser-independent approach to...

6 mins read
What’s a DDOS attack? A Distributed Denial of Service (DDoS) is a type of cyber attack in which a hacker...
3 mins read
Mimecast is an information security company focused on protecting digital consumers’ email security through a suite of commercial cybersecurity solutions. ...

2 mins read
Grayscale is a visual art characteristic in which an image is composed exclusively of shades of gray. Each shade of...

2 mins read
A petabyte is 1015 bytes of digital information. The unit symbol for the petabyte is PB. It is a measure...

3 mins read
Internet protocol (IP) is a primary set of communication protocols for exchanging data packets or datagrams across internet-connected networks. The...

2 mins read
Performance management software is a platform for organizations to measure employee productivity in alignment with the organization’s business objectives. It...

3 mins read
NoSQL (Not Only SQL) is a type of database for web applications and big data which allows users to store...

1 min read
In graphical user interfaces, to “zoom” or “zoom in” is to make a window larger to see the window’s contents...

2 mins read
The Pareto Principle holds that 80 percent of consequences can come from 20 percent of causes. Named after the Italian...

4 mins read
A thumb drive, or USB flash drive, is a small device with flash memory used for storing, reading, writing, and...

3 mins read
A pipeline is a figurative measurement of client or customer progress through a set of business-defined stages. The term is...

3 mins read
Direct marketing is a strategy for selling products and services directly to customers. Direct marketing materials are crafted with a...

2 mins read
A compact disc (CD) is a polycarbonate disc measuring 120 mm in diameter with one or more metal layers capable...

1 min read
A light emitting diode (LED) is an electronic component that emits (gives off) light when an electrical current is passed...

5 mins read
Management software is a general phrase used to describe a category of computer software designed to help streamline the complexity...

3 mins read
monday.com is a cloud-based work operating system that can be used for a variety of needs, including project management, collaboration,...
4 mins read
The secure socket tunneling protocol (SSTP) is a VPN protocol where communications between two points use the transport layer security...

5 mins read
Telecommunication refers to telephony and cellular network technology. However, the broader definition includes all wired and wireless networks, such as...

9 mins read
What is spoofing? As it pertains to cybersecurity, spoofing is when a person disguises themself as a trusted source to...

4 mins read
A webcam, short for web camera, is a piece of video hardware that is either external or internal to a...

4 mins read
The binary system in computing uses the base 2 number system to power the majority of computational processes. Unlike the...

3 mins read
Piracy is when a malicious person or group steals goods or resources from another person or group. Applied to the...

4 mins read
One of Microsoft Office’s core products, PowerPoint – abbreviated to PPT based on its file extension “.ppt” – is a...

3 mins read
The public domain describes the status of intellectual property or copyrighted work that is freely available for use and reproduction...

7 mins read
VMware Workstation is a line of hosted hypervisor products running on x64 computers that allows users to run virtual machines,...
3 mins read
A CSV or .csv is a comma separated values file that separates data values using commas or another common delimiter....

2 mins read
A web application is a software program (or website) capable of receiving dynamic content requests and delivering resources over the...

2 mins read
A framework in software development is a construct, built on a specific programming language, that simplifies application development. A framework...

2 mins read
A regular expression, abbreviated as RegEx or regex, is a pattern for locating a character string in a program. A...

3 mins read
A USB port is a connection point for devices that support wired Universal Serial Bus (USB) connections. It was introduced...

2 mins read
A rich text format (RTF) file is a word processing document that can be accessed by most major word processors....

1 min read
Short for commercial off-the-shelf, an adjective that describes software or hardware products that are ready-made and available for sale to...

3 mins read
Scraping is the process of using automated tools to collect large amounts of data output from an application, website or...

1 min read
OpenShift is an open source hybrid cloud application Platform as a Service (PaaS) developed by Red Hat. Red Hat also...
3 mins read
Data science is an interdisciplinary study of data using advanced tools and techniques to detect patterns, extract information, and inform...

10 mins read
Near Field Communication Near field communication (NFC) is a protocol that allows two devices to communicate wirelessly via radio signal...

13 mins read
Gap analysis is the process of assessing and comparing the differences between actual performance and potential or desired performance to...

3 mins read
Copyright infringement is the illegal use, production, or sale of materials copyrighted by another person or organization. When rights granted...

3 mins read
What is a passphrase? A passphrase is a string of words used to help users remember longer, more complex passwords....

5 mins read
Updated by Jenna Phipps Google Hangouts is a cloud-based messaging and video chat application developed by Google. It started as...
2 mins read
Superword level parallelism (SLP) is an advanced method of traditional vectorization that facilitates parallelism across loop iterations, SIMD, and basic...

2 mins read
Gross revenue is the total amount of money (income) earned by a company over a period of time. The term...

7 mins read
What is Hello World? A Hello World program is a computer program that outputs or displays the message, “Hello, World!”...

2 mins read
Over-the-air (OTA) refers to the wireless transmission of information. It is most commonly used for sending information to Internet-of-things (IoT)...

4 mins read
Digital Darwinism is the application of Darwin’s Theory of Evolution to the digital economy, where an organization’s success or failure...

2 mins read
Instantiation is a computer programming term, used by developers, that is usually related to Object-Oriented Programming (OOP). At its core,...
2 mins read
An iFrame, short for inline frame, is an HTML document embedded within another HTML document. Web developers frequently use iFrames...

11 mins read
E-commerce, or electronic commerce, is online-conducted business, including marketing, sales, and fulfillment. Consumers and businesses place and track orders at...

5 mins read
The acronym TaaS stands for Testing-as-a-Service, a service delivery model where software testing and validation is provided by an...

3 mins read
What is a hackerspace? A hackerspace, also known as a hacklab, incubator, or hackspace, is a flexible workspace designed for...

4 mins read
Random access memory (RAM) is a high-speed component in devices that temporarily stores all information a device needs for the...

2 mins read
OEM – Original Equipment Manufacturer reviewed by Web Webster What is OEM? OEM (pronounced as separate letters) is short for...

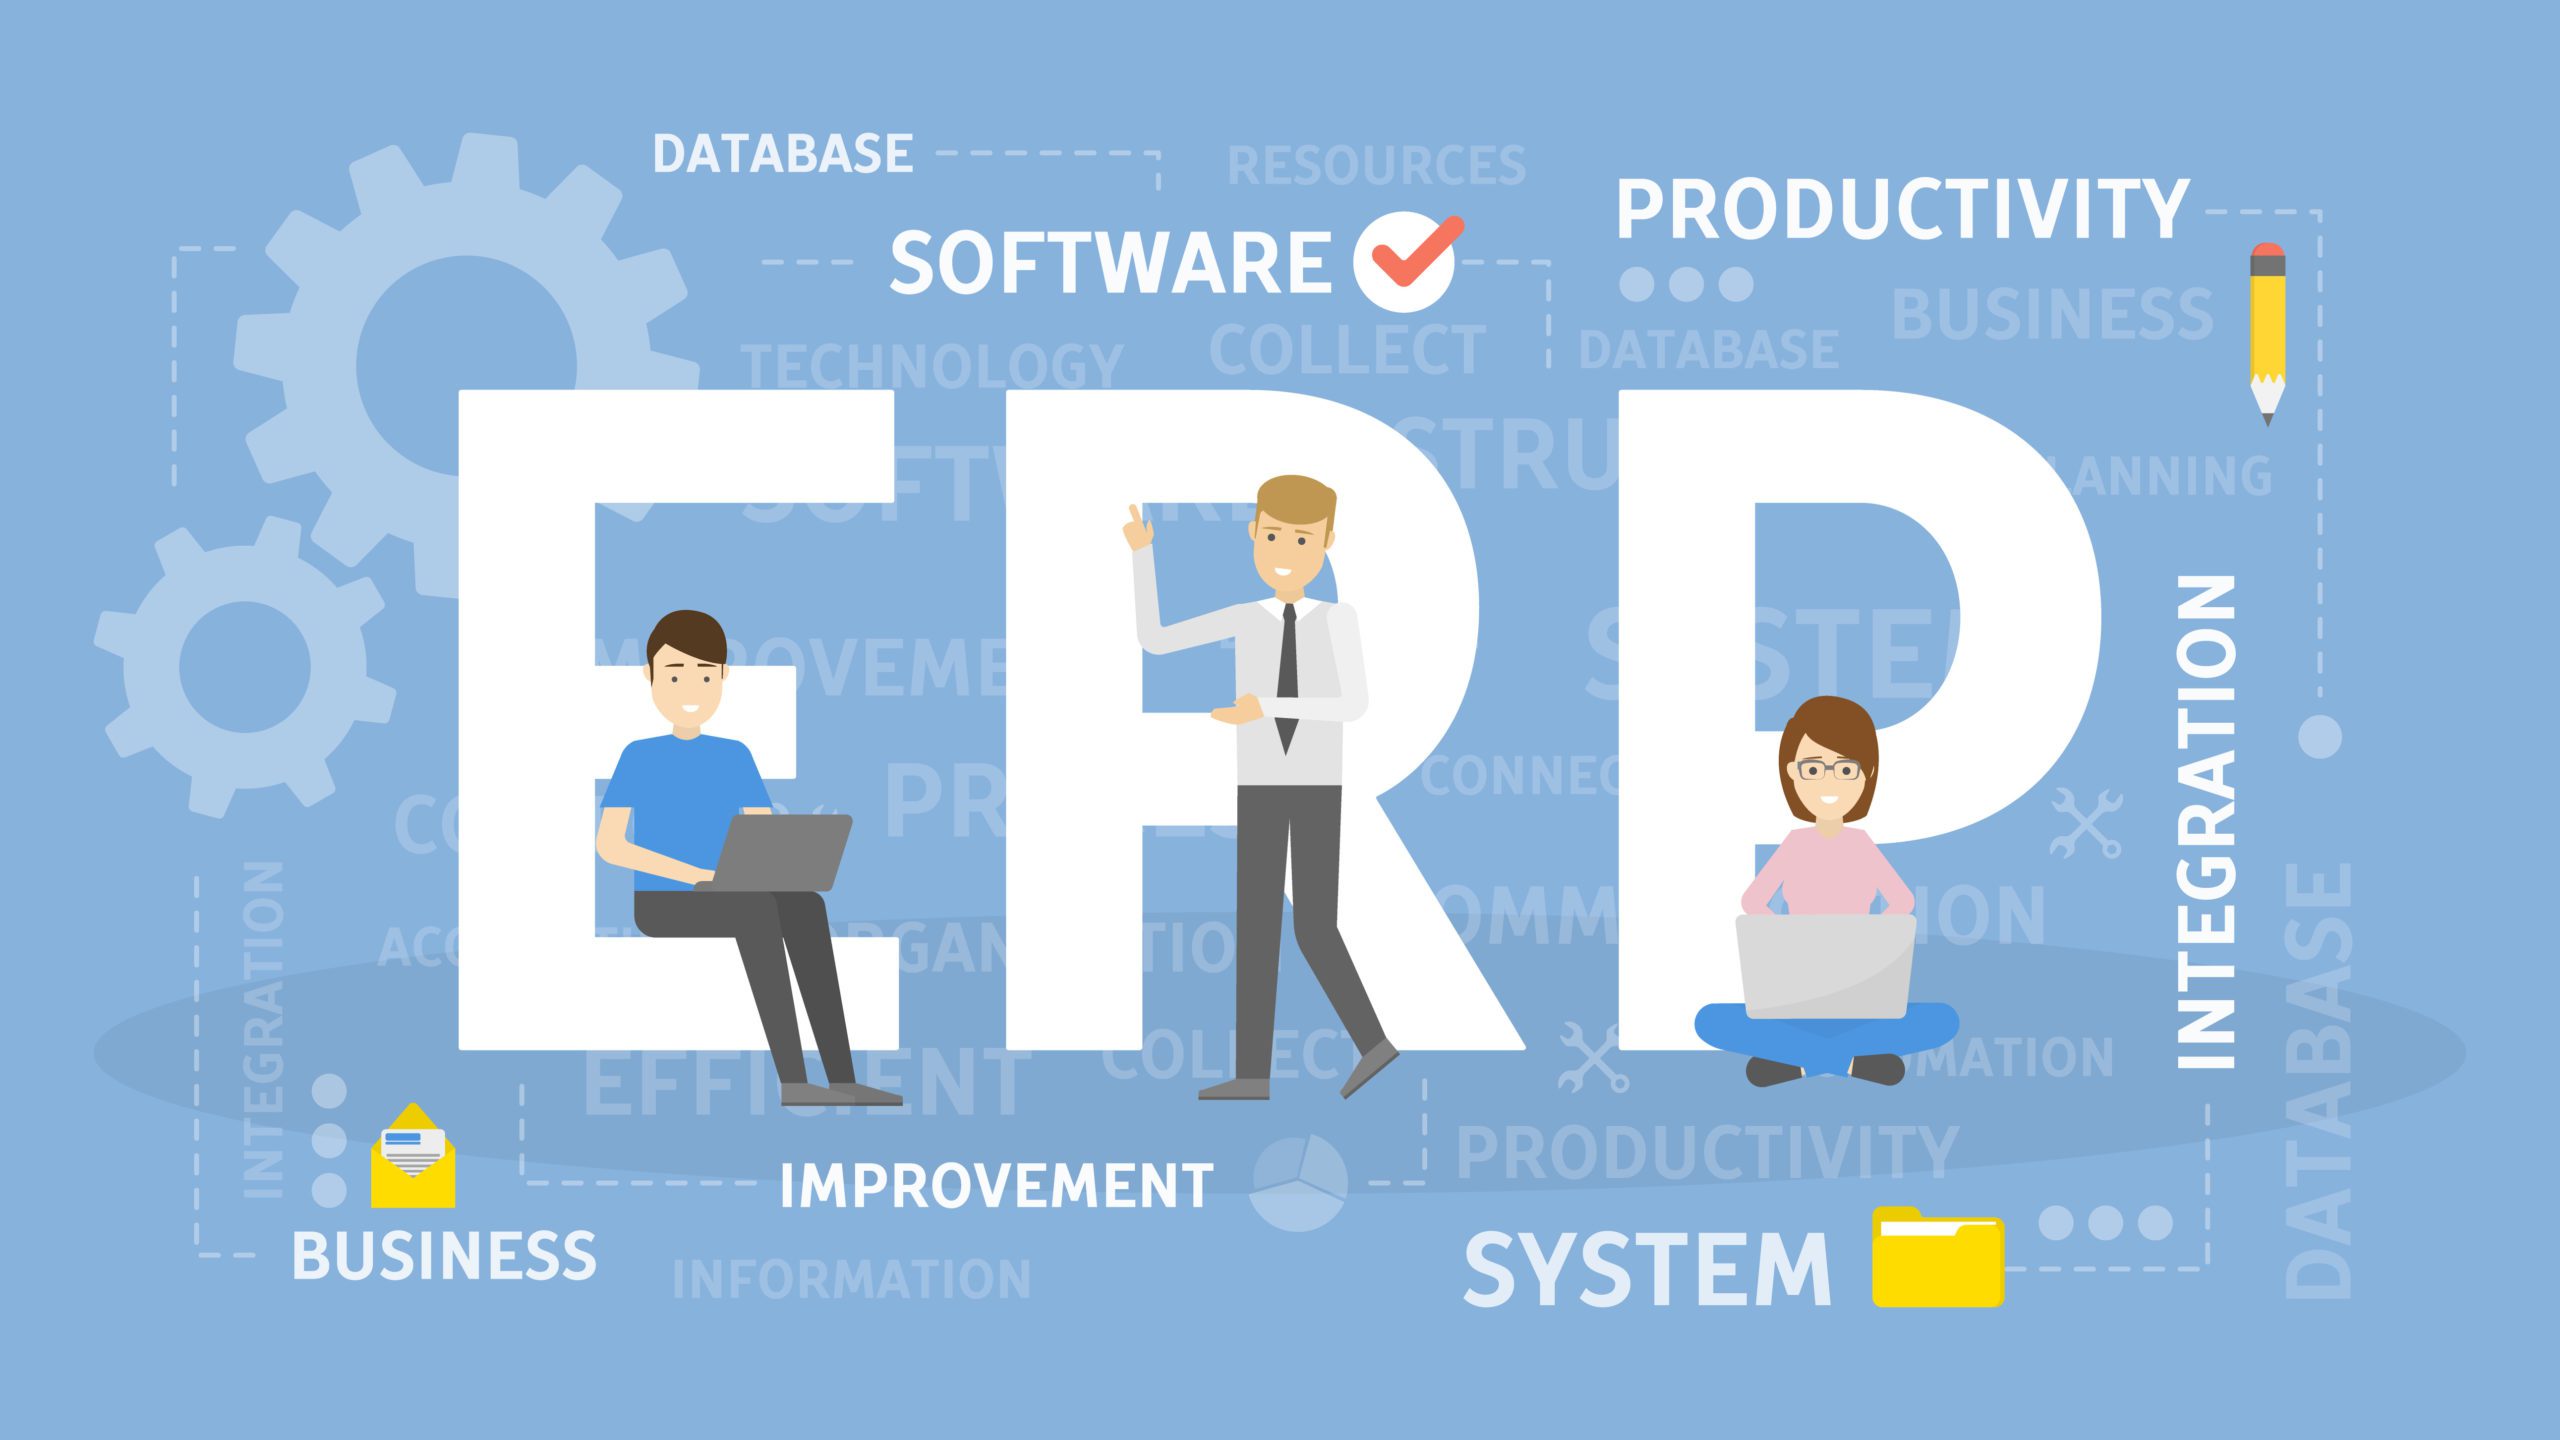
5 mins read
Enterprise resource planning (ERP) is business process management software that allows an organization to use a system of integrated applications...
8 mins read
Service Set Identifier (SSID) reviewed by Web Webster The internet is an essential tool for billions of people, with...

3 mins read
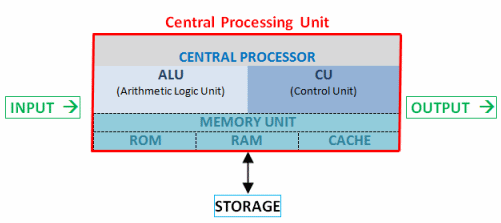
Reviewed by Jenna Phipps What is a CPU? CPU (pronounced as separate letters) is the abbreviation for central processing...
3 mins read
Reviewed by Web Webster A key fob is a physical device that uses radio frequency identification (RFID) and symmetric encryption...

8 mins read
Reviewed by Web Webster Early computers were large, power-hungry machines that used vacuum tubes and required manual programming with punched...

6 mins read
What’s the OSI model? The Open Systems Interconnection (OSI) model is a framework that conceptualizes how computers within a...

3 mins read
A network security key is a form of a physical, digital, signature, or biometric data used to authorize a user...
3 mins read
Digital transformation is an organizational process that enhances the effectiveness of systems to take advantage of the efficiency, scalability, and...
2 mins read
What is file locking? File locking is a mechanism used to secure the integrity of files being shared between users....
2 mins read
Amazon CloudFront is a content delivery network from Amazon Web Services (AWS). The service enables companies to deliver data, applications,...
2 mins read
Parallel computing is a type of computer structure in which multiple processes are executed at the same time. It is...
13 mins read
What is a gig worker? A gig worker, or non-traditional worker, is a worker whose income-earning activities are outside of...
2 mins read
What’s a VPN concentrator? A VPN concentrator is a tool that helps manage numerous simultaneous remote virtual private network connections....
4 mins read
Amazon is a technology company that’s primarily focused on ecommerce, cloud computing, digital streaming, and artificial intelligence. According to the...
15 mins read
5G is the fifth generation of cellular networks, offering higher frequency waves and greater bandwidth on wires and wireless connections....

10 mins read
What is phishing? Phishing is a type of cybercrime in which a hacker poses as a trustworthy entity to obtain...

4 mins read
No-code development is a method of application development that allows people without programming experience to design apps. Along with low-code...
3 mins read
DMVPN is a type of virtual private network designed by Cisco that uses multiple networking protocols to create secure tunnels...
3 mins read
Risk management is the process of identifying, analyzing, and responding to risk factors to minimize the effects of risk on...
3 mins read
The Criminal Justice Information Services (CJIS) division of the FBI provides relevant data and tools to law enforcement and intelligence...
3 mins read
An artificial neural network (ANN) is a part of a computer system based on artificial neurons that mimic the behavior...
3 mins read
Data scientists are interdisciplinary experts who use a range of skills to synthesize, process, and interpret large volumes of structured...
2 mins read
Microlearning is an education model in which lessons are typically delivered in condensed, hyper-focused segments. It’s a form of e-learning,...
3 mins read
Wikipedia is a multilingual, free online encyclopedia. The information is crowd-sourced and can be openly edited by people all around...
3 mins read
Network infrastructure is a term for everything that comprises a computer network. This includes hardware (wires, routers, and software) which...
2 mins read
Deep packet inspection is a networking technology for analyzing data packets in more detail than traditional packet filtering. Deep packet...
3 mins read
Interactive voice response (IVR) is a telephony technology that filters phone calls based on callers’ responses through either vocal feedback...
2 mins read
TypeScript is an open source programming language that was developed by Microsoft as a superset of JavaScript. This means that...
2 mins read
A data plane, or forwarding plane, is the part of a router that examines an incoming data packet and sends...
2 mins read
Microsoft SQL Server (pronounced by each letter or as sequel) is a relational database management system managed by Microsoft. It...
2 mins read
An applet is a small, supplemental program that supports a larger program. It typically performs one specific task and runs...
3 mins read
Network segmentation is the division of an entire network into smaller segments or sub-networks (subnets). For example, if a business...
2 mins read
By Vangie Beal A router is a piece of hardware (or software) that receives, filters, and sends data packets...
2 mins read
Legacy code refers to source code that has been inherited from a previous version of a website or software application....
4 mins read
Cybersecurity awareness training informs employees of the attack surfaces and vectors in their company and how they can avoid falling...
3 mins read
A supply chain is a network between an organization and its suppliers to deliver goods and/or services to the final...
3 mins read
What is COBOL? COBOL stands for Common Business-Oriented Language. It is a 60-year-old programming language that is still widely used...
2 mins read
Shared hosting is a web hosting model in which multiple sites occupy the same server. Each website is hosted privately...
3 mins read
Database integration consolidates data from multiple sources to provide businesses with more comprehensive views and opportunities to use that data....
3 mins read
A serial number is a unique product identifier that enables a manufacturer to recall information about the individual item. Hardware...
3 mins read
A software developer manages the creation of code, the facets of software or an application, and its deployment and updates....
2 mins read
A message authentication code (abbreviated MAC), used in symmetric cryptography, is attached to a message so that a recipient can...
3 mins read
Direct current is electrical current that flows steadily in one direction between two ends of a circuit. In an electrical...
2 mins read
OpenOffice is an open source software for word processing, spreadsheets, and other office-suite applications. The software mainly utilizes the C++...
3 mins read
A singleton is a software design pattern that restricts the instantiation of a class to one single instance. Instantiation is...
2 mins read
A transformer is a system that uses the principle of electromagnetic induction to increase or decrease voltage in adjacent electrical...
3 mins read
Also referred to as DNS cache poisoning, Domain Name Server (DNS) spoofing is a form of computer security hacking in...
2 mins read
SQL Developer is a free database management software offered by Oracle, one of the leading database management companies in the...
2 mins read
A startup, sometimes written start-up, is a company or project undertaken by one or more entrepreneurs to develop a unique...
2 mins read
Adobe Flash Player is software used to run content created on the Adobe Flash platform, such as viewing multimedia content,...
3 mins read
A dofollow link (or follow link) is one that indicates to search engines that the destination page should be crawled....