Bitcoin vs. Nasdaq: Why Missing BTC’s Best Trading Days Cuts Returns From 225% to an 11% Loss

Key Takeaways
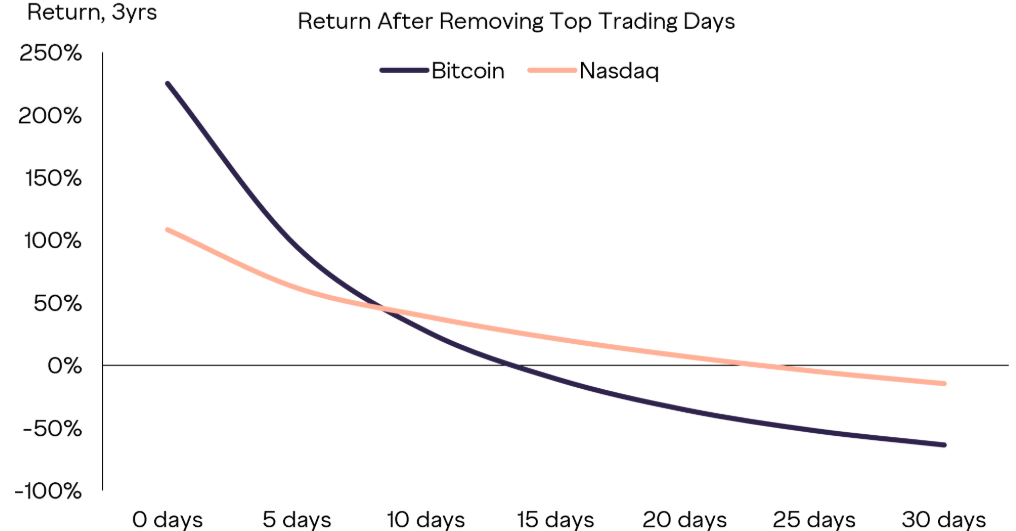
- Bitcoin returned approximately 225% over three years, compared with 109% for the Nasdaq-100.
- Missing BTC’s five best days cuts its return to 95%, and excluding its 10 strongest days reduces the gain to 27%.
- The findings highlight the potential cost of market timing, as brief rallies can disproportionately shape long-term returns.
Bitcoin outperformed the Nasdaq 100 over the three years through Sept. 23, 2026, but missing just 15 of its strongest days would have turned that advantage into a loss.
A Grayscale analysis using Bloomberg data shows Bitcoin returned approximately 225% over the period, compared with 109% for the Nasdaq-100.
Remove Bitcoin’s 15 best daily returns, however, and its cumulative performance drops to negative 11%.
The comparison highlights how heavily Bitcoin’s gains depended on brief bursts of upside, and why investors trying to avoid volatility can also miss the rallies that determine longer-term results.
Five Days Erase More Than Half of Bitcoin’s Return
Removing Bitcoin’s five best days reduces its three-year return from 225% to 95%. Excluding the 10 strongest days lowers the gain to 27%, while removing 15 pushes the result into negative territory.
Those figures illustrate a sharp concentration of returns. Five days account for less than 0.5% of the calendar days in a three-year period, yet excluding them reduces Bitcoin’s cumulative percentage gain by more than half.
For an illustrative $10,000 investment, the difference is substantial. A 225% return would increase its value to approximately $32,500. Without the five best days, the ending value falls to $19,500.
Missing the top 10 days leaves $12,700, while excluding the strongest 15 reduces the investment to $8,900, before costs.
The Nasdaq 100 also depended heavily on its strongest sessions, although the effect was less severe. Removing its 15 best days reduced the index’s three-year return from 109% to 21%, leaving it positive.
Under that scenario, an illustrative $10,000 investment would finish at $12,100, compared with $20,900 across the full period.
Why Waiting for Calm Can Mean Missing a Recovery
The findings expose a central challenge of market timing: deciding when to sell is only one part of the trade. Investors must also determine when to return.
Someone who exits during turbulence may avoid further losses, but staying out during a rapid recovery can materially weaken the eventual result.
Similar patterns appear in equity markets. Wells Fargo Investment Institute notes that the strongest and weakest stock-market days have often occurred close together, sometimes on consecutive trading days. That proximity makes it difficult to separate rebounds from sell-offs.
Its analysis examines the S&P 500 rather than Bitcoin, so it does not establish that BTC’s best days followed the same pattern during this particular period.
Nevertheless, it offers context for the timing problem: conditions that encourage investors to retreat can also surround powerful positive sessions.
For Bitcoin, the supplied figures show that relatively few daily moves dramatically changed the three-year outcome. Waiting for a clearer outlook, therefore, carries a potential opportunity cost, as well as the risk of remaining exposed during declines.
What the Comparison Proves and What It Leaves Out
The analysis demonstrates return concentration, rather than proving that holding Bitcoin always beats active trading.
Removing only the strongest days is a hypothetical exercise. It leaves the weakest days in the calculation and does not show what would happen if an investor also avoided significant losses.
Wells Fargo acknowledges this distinction: missing the worst sessions can improve returns, although identifying them separately from the best sessions is difficult.
The comparison also uses spot BTC/USD and the Nasdaq 100 Index, rather than actual investment products. Management fees and expenses are excluded, and investors cannot buy an index directly.
Bitcoin trades continuously, while Nasdaq sessions follow an exchange calendar, adding another methodological consideration.
The figures support a narrower conclusion: Bitcoin’s historical upside was concentrated enough that missing a handful of exceptional days could overwhelm its apparent advantage over technology stocks. They do not guarantee that future exposure will produce similar gains.


