
Key Takeaways
- The biggest liquidation waves in Bitcoin’s history reveal the chaos of sudden market selloffs sparked by global tensions and policy shifts.
- Over-leveraged traders face rapid collateral losses when regulatory fears or corporate decisions jolt prices downward.
- Thin liquidity and cascading forced exits amplify these brutal market drops, exposing systemic risks.
- Smart position sizing and vigilant event monitoring help traders navigate this volatile landscape unscathed.
In a single 36-hour window in October 2025, $19.16 billion in leveraged crypto positions were force-closed — $5.3 billion of it on Bitcoin alone. That kind of cascade does not start with a sell button; it starts with a leveraged trader’s collateral dipping below maintenance, an exchange’s auto-deleverager kicking in, and the resulting market sell wiping out the next position in line. Liquidation waves are the part of the chart where market structure matters more than fundamentals.
Below are the ten largest Bitcoin liquidation events on record (data: CoinGlass), with the trigger behind each one and what it tells you about how leverage cascades through the market.
10 Biggest Liquidation Waves in Bitcoin’s History
| Date | BTC Total Liquidations (Approximate) | Cause Of Liquidation |
|---|---|---|
| October 10 to 11, 2025 | $5.3 Billion | Macro shock from tariff announcement and heavy margin positions. |
| September 7, 2021 | $1.3 Billion | El Salvador rollout issues and sell the news reaction |
| September 22, 2025 | $896 Million | Macro signals and a stronger dollar led to long liquidations. |
| February 25, 2025 | $625.2 Million | Trade tensions and ETF selloff. |
| December 5, 2024 | $564.4 Million | Bitcoin’s surge triggers a liquidation cascade. |
| August 1, 2025 | $546.6 Million | Tariff-triggered slump causes tumble. |
| December 4, 2021 | $490.9 Million | Red Saturday: Bitcoin’s sudden fall. |
| August 5, 2024 | $407.7 Million | Price volatility triggers cascading market sell-offs. |
| April 13, 2024 | $340.96 Million | Leveraged longs collapse amid global geopolitical tension. |
| August 17, 2023 | $305.5 Million | Suffen sell-off triggers market response. |
Note: The information in this table, along with the accompanying visualizations, is derived from CoinGlass.
October 10 to 11, 2025 | Record Tariff Shock | $5.3 Billion

US – China trade tensions escalated after Washington announced sweeping tariffs and export restrictions. Markets reeled, and Bitcoin, trading near record highs, became collateral damage. Over-leveraged longs got liquidated across Binance, Bybit, and Hyperliquid.
Within 36 hours, $19.16 billion in positions vanished. Bitcoin’s price dipped nearly 15% before partially recovering. It remains the largest liquidation wave ever recorded in crypto.
September 7, 2021 | El Salvador Rollout Disappointment | $1.26 Billion
On the day Bitcoin became legal tender in El Salvador, enthusiasm turned to confusion. Technical issues with the government wallet and profit-taking from earlier buyers combined to spark a sharp drop.

Exchanges saw nearly $4 billion in long liquidations as Bitcoin fell from about $50,000 to $46,000 within hours. The market quickly recovered, but the day served as a lesson that major policy rollouts can create unpredictable reactions even during bullish sentiment.
September 22, 2025 | Over-Leveraged Longs Flushed | $896 Million
After a strong summer, macro signals shifted. Traders parsed hints of tighter policy and a stronger dollar tone. Crypto tracked broader risk assets and pulled back. Funding metrics and open interest pointed to crowded longs. The move lower forced positions to close.

Bitcoin slipped around 8%. Reported Bitcoin liquidations came in near $89 6million, concentrated in long positions across majors. Correlation with macro drivers stood out more clearly than in earlier cycles.
February 25, 2025 | Trade Tensions and ETF Selloff | $625.2 Million
Bitcoin plummeted to $86,000, erasing approximately $1.6 billion in trading positions within a day. The fall followed renewed tariff threats from President Donald Trump against Mexico and Canada, paired with a $500 million selloff of Bitcoin ETFs.
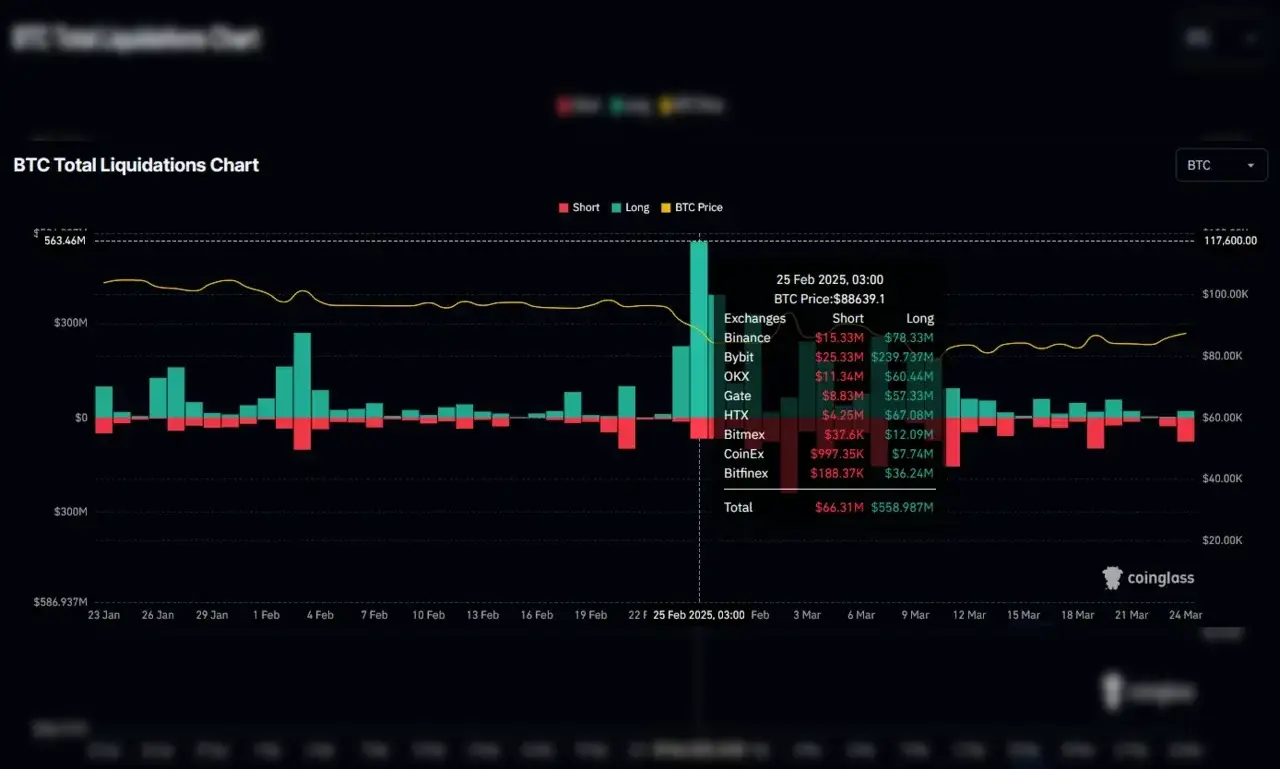
The downturn pushed Bitcoin below $86,000 and affected over 350,000 traders, with long positions facing losses as high as $1.4 billion. Ethereum and XRP also suffered heavy liquidations. Mounting trade uncertainty and institutional outflows amplified volatility across major digital assets.
December 5, 2024| Bitcoin’s Surge Triggers a Liquidation Cascade | $565 Million
After weeks of steady gains, Bitcoin hit a record high of $103,900 on December 5, 2024, before abruptly plunging to $97,000.

The swift reversal led to liquidations exceeding $565 million in Bitcoin positions, pushing total crypto liquidations past $1 billion. The event followed widespread enthusiasm after Bitcoin crossed the long-awaited $100,000 mark, even drawing remarks from then US President-elect Donald Trump. It was caused by over-leveraged longs and profit-taking at peak levels.
August 1, 2025 | Tariff-Triggered Slump Causes Tumble | $546.6 Million
On August 1, 2025, global markets turned cautious after the Donald Trump administration announced new trade tariffs and July US employment figures underwhelmed expectations. The announcement of tariffs on major trading partners weighed on investor sentiment, and the report showing weaker job growth suggested possible economic cooling.

The digital-asset sector responded sharply, with Bitcoin dropping below $115,000 while several crypto-linked equities suffered deeper losses. In that climate, leveraged long positions were squeezed, triggering forced liquidations across futures markets and contributing to the downturn.
December 4, 2021 | Bitcoin’s Sudden Fall and a $2.3 Billion Wipeout | $490.9 Million
Bitcoin suffered one of its sharpest single-day declines of 2021, plunging by more than 20% to about $44,000. The drop triggered widespread liquidations, erasing roughly $2.3 billion ($490.9 million for BTC) from traders’ positions and rattling markets already uneasy about global economic trends and regulatory uncertainty.

More than 375,000 investors saw their leveraged bets wiped out in hours as sell orders cascaded across major exchanges. The fall was likely the result of a combination of profit-taking, thin weekend liquidity, and growing risk aversion in traditional markets. The shock decline ended weeks of relative stability, reminding traders how quickly sentiment can reverse in digital asset markets.
August 5, 2024| Markets Tremble as Leverage Unwinds Across Digital Assets | $407.7 Million
Global risk sentiment turned sour on August 5, 2024, triggering a sharp correction across digital assets and traditional markets. More than $1 billion in leveraged positions vanished within hours, with traders caught off guard by a broad sell-off following weak US tech earnings and renewed concerns about monetary tightening.

The downturn hit major tokens hardest, erasing gains built over weeks of optimism. It reminded traders how swiftly market confidence can erode when leverage builds too high against a backdrop of tightening liquidity and global uncertainty.
April 13, 2024| Leverage and Tension Fuel Sharp Crypto Dip | $340.9 Million
An 8% price drop sent Bitcoin below $62,000, triggering $319 million in liquidations over 24 hours. Most losses hit leveraged long positions, amplifying selling pressure as stop losses were executed across exchanges.
Geopolitical tensions in the Middle East heightened market uncertainty, prompting cautious investors to reduce exposure to risky assets. Technical support levels around $63,000–$64,000 were breached, accelerating the cascade of liquidations.

Despite the sudden decline, partial recovery occurred by the end of the session. The event illustrated how a mix of high leverage, market sentiment, and external geopolitical factors can create rapid but temporary corrections in volatile crypto markets.
August 17, 2023| Sudden Sell-Off Sends Markets Reeling | $305.5 Million
A steep overnight decline wiped billions from digital asset markets, sparking one of the harshest liquidation waves of 2023. Prices plunged nearly 7%, briefly pushing the leading token below $26,000 and triggering more than $1 billion in forced position closures across major exchanges, with BTC liquidation reaching $305.5 million.

The drop echoed across related assets, deepening losses and prompting a sharp spike in trading volume. Within hours, open interest collapsed, leaving markets shaken and traders reassessing exposure levels after one of the sharpest single-day pullbacks of the year.
What is A Liquidation In Crypto?
When traders use leverage and their collateral isn’t enough to cover losses, the platform steps in and shuts the position down. That’s a liquidation. Exchanges and lending apps do this automatically to stop accounts from going negative. They sell the trader’s collateral at the current market price, which can add extra selling pressure and push prices down even more.
Liquidations occur across centralized and decentralized exchanges and work through wrapped contracts or on-chain auctions. The mechanics differ by platform, but the outcome often looks similar on price charts. Market participants watch these events because they reveal stress points in funding and collateral models.
Why Do Crypto Liquidations Happen?
When prices swing hard, traders using margin can see their collateral shrink fast. If it drops too much, exchanges step in and automatically close those positions to prevent bigger losses.
Things can snowball. Thin order books, crowded trades, scary headlines, or even a tech hiccup can all make forced selling hit harder. Weekends are riskier too. There’s less liquidity, and funding rate shifts can push fills far away from the “fair” price.
One big shock often becomes many. If lots of traders use similar leverage and risk settings, a single liquidation wave can cascade across the market.
What helps? Keep position sizes reasonable, avoid over-leverage, and spread your collateral. That way, you’re less likely to get force‑closed when the market whips around.
What These Liquidation Waves Teach You About Leverage
A few patterns are repeated across all ten events: leverage was crowded on one side, an exogenous trigger arrived (tariffs, policy, ETF outflows), and thin liquidity at the wrong hour turned what should have been a 3% move into a 10-15% move. Knowing the date of each wave is less useful than recognising the setup.
A practical checklist: keep position size at a fraction of what your collateral can technically support; avoid concentrated entries before scheduled policy events (FOMC, employment data, tariff windows); and avoid weekend leverage when liquidity is thinnest. The next big liquidation event will not be on this list — yet — but it will follow the same shape.